EWG Study and Mapping Show Large CAFOs in Iowa Up Fivefold Since 1990

Jamie Konopacky, Midwest Director, and Soren Rundquist, Director of Spatial Analysis

TUESDAY, JANUARY 21, 2020

The number of large concentrated animal feeding operations, or large CAFOs, in Iowa increased nearly fivefold in the past two decades, a new study from Environmental Working Group reveals, with almost all of the growth from big hog-feeding operations.

EWG found that in 1990, Iowa had 789 large CAFOs – those housing 1,000 or more animal units – swelling to 3,963 in 2019.1 The findings are supported by the federal Census of Agriculture, which reported that Iowa, the top hog-producing state, housed more than 22.7 million hogs in 2017, an increase of 8.5 million since 1992.

Swine and other livestock raised in Iowa’s large CAFOs now produce 68 billion pounds of manure a year – conservatively, 68 times the total amount of fecal waste produced each year by the state’s 3.15 million residents.

Large hog CAFOs house a minimum of 2,500 pigs each, and the largest hog CAFO in Iowa houses 24,000 animals. In total, more than 60 percent of the animal waste produced by the largest CAFOs in Iowa comes from hogs. The mountains of animal waste produced by these facilities pose a serious and growing threat to human health, the environment and water resources in the state.

EWG used satellite and aerial imagery to pinpoint where and when the new large CAFOs appeared in Iowa. The interactive map below shows their locations, the type of facility, the animals housed there and the growth in facilities over the past two decades.

Explore the Map

Our investigation found that hog facilities account for 94 percent of all CAFO growth since 1990, as shown in the charts below. But not all of the growth comes from new operations: Expansions of existing facilities have also contributed significantly to the boom. Since 1990, 27 percent of existing facilities have added at least one barn to their operations – swine facilities accounted for 71 percent of that expansion.

The Threat to Human Health and Water Resources

Unlike human waste, which generally goes through a multistage treatment process before being released back into the environment, the 68 billion pounds of manure produced annually by Iowa’s large CAFOS are typically spread, untreated, over agricultural fields. Once the manure is spread on fields, the nitrogen, phosphorus and bacteria it contains can seep into groundwater or run off to contaminate lakes and streams.

With so much manure on Iowa’s landscape, it’s not surprising that pollution is fouling Iowa’s drinking water, some of the state’s favorite beaches and other water recreation areas. Bacteria and nitrogen contamination has been documented in Iowa’s drinking water supplies and surface water, and outbreaks of toxic algae forced the closure of more than 20 beaches in 2019 alone. These outbreaks are triggered by nitrogen and phosphorous from fertilizer, manure and other sources.

The Impact on Private Drinking Water Wells

A recent report from EWG and the Iowa Environmental Council shows that many households whose drinking water comes from private wells are struggling with contamination from nitrate and bacteria. The report found that of 54,000 private wells tested, 40 percent were contaminated with coliform bacteria. The report also documents elevated levels of nitrate at or above 5 milligrams per liter – the level linked to an increased risk of cancer – in more than 12,000 household wells.

Public Drinking Water Impact

Communities that provide residents water through public supplies are also struggling to keep nitrogen out of their drinking water. Most recently, residents of the Amana Colonies, a cluster of villages near Iowa City, were warned not to drink their tap water because nitrate levels exceeded the federal legal limit of 10 milligrams per liter. That limit was set in 1962 by the Environmental Protection Agency to guard against blue baby syndrome, a potentially fatal condition that starves infants of oxygen if they ingest too much nitrate. Since then, a growing body of research indicates increased cancer risk at levels well below the legal limit.

Citizens Are Pushing for Appropriate Monitoring and Regulation of Factory Farms

In 2007, state environmental organizations asked the EPA to take over regulation of CAFOs in Iowa, arguing that the state had failed to regulate CAFO pollution according to the requirements of the federal Clean Water Act. In response, in 2012, the EPA issued a preliminary report that found Iowa had indeed failed to issue required CAFO permits, conduct inspections and issue required penalties as required by federal law.

Iowa’s failure to appropriately monitor and control pollution from CAFOs was raised by Iowans again in early 2019. Iowa Citizens for Community Improvement and Food and Water Watch have filed a lawsuit to protect the drinking water of approximately half a million Iowans in four counties served by Des Moines Water Works. That lawsuit alleges that the Iowa Department of Natural Resources has still failed to issue a single Clean Water Act permit to address water pollution from a hog CAFO anywhere in Iowa.

Time for a New Approach

In May 2013, Iowa adopted a Nutrient Reduction Strategy, which aims to achieve a 45 percent reduction in both nitrogen and phosphorus largely through voluntary, incentive-based programs to reduce farm pollution. But the state’s progress reports have not been encouraging. The 2017 progress report acknowledges that implementation of the voluntary approach laid out in the Nutrient Reduction Strategy has only “scratch[ed] the surface of what is needed across the state to meet the nonpoint source nutrient reduction.” Moreover, the most recent progress report, issued at the beginning of 2019, estimates that cover crops have been planted on only 760,000 acres of farmland in Iowa. This represents approximately 5 percent to 8 percent of the total acreage that must be planted in cover crops – between 10 and 14 million acres – to meet the strategy’s 45 percent nutrient reduction goals.

Despite the Nutrient Reduction Strategy’s less than impressive track record on water quality improvements, in July 2018, the state legislature doubled down and declared the strategy to be the state’s official policy for addressing nitrogen and phosphorus pollution of water resources.

Conclusion

It is abundantly clear that Iowans face an enormous public health risk from the huge and growing quantities of animal manure produced just by the largest CAFOs in the state. To ensure safe drinking water and swimmable beaches, Iowa needs to make big changes immediately. Without adequate management of CAFO facilities, Iowans will continue to face a growing threat of serious – in some cases, life-threatening – illnesses from bacteria, nitrates and cyanotoxins in their water.

Methods Summary

To produce this report, EWG used geospatial data on permitted animal feeding operations recorded by the Iowa Department of Natural Resources. For the survey, EWG analyzed all active operations in the state housing 1,000 or more animal units. These large operations make up a third of all operations and two-thirds of all livestock in Iowa. EWG tracked the growth of these facilities over time, using seven years of high-resolution aerial photography and satellite imagery from 1980 to 2019. (For full methodology, click here.)

Large swine animal feeding operation growth captured in Palo Alto County, Iowa.

Source: USDA, National Agriculture Imagery Program (1m) 2011, 2019

Key Points


Methodology

Expand content Collapse content

Methodology for Dating Large Animal Feeding Operations in Iowa

By Sarah Porter, Senior GIS Analyst, and Soren Rundquist, Director of Spatial Analysis

Special thanks to EWG intern Jack Acomb.


Overview

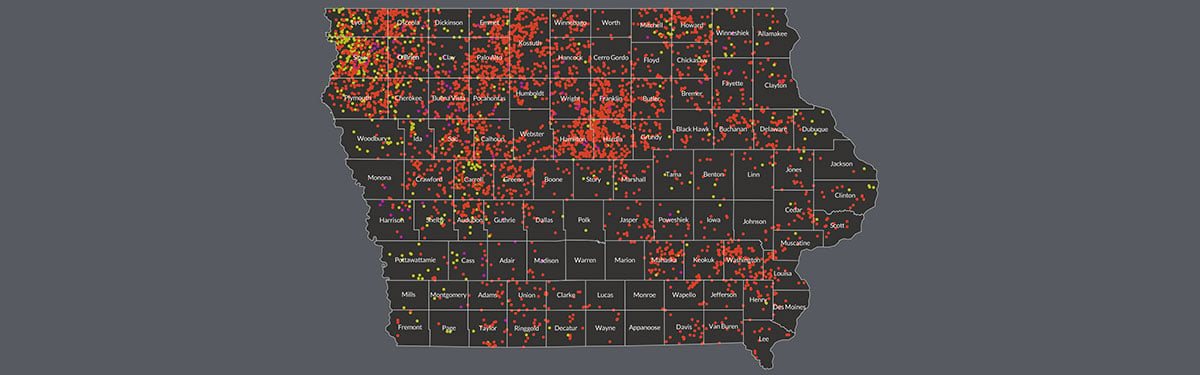
EWG used high-resolution aerial photography and satellite imagery to analyze large animal feeding operation growth in Iowa between 1980 and 2019.

Data

The Iowa Department of Natural Resources, or DNR, maintains a database of animal feeding operations, or AFOs, permitted in the state. Iowa tracks data on two types of DNR-regulated AFOs, both of which house animals kept and fed for 45 days or more per year: confinements and open feedlots. The DNR publishes this information as attributed point locations. EWG downloaded these data from the Iowa Geodata website on July 30, 2019.

The dataset included general information for 12,358 operations, including but not limited to: facility name, facility status, facility location and number of animal units of each animal type. An animal unit is defined as an animal equivalent of 1,000 pounds live weight, with a single animal unit equating to 1 beef cattle, .7 dairy cattle, 2.5 swine weighing more than 55 pounds, 125 broiler chickens, or 82 laying hens or pullets.1

Active Operations with Dominant Animal Type

Three hundred and seventy-two facilities had no animal units listed for the dominant livestock groups and were removed from the analysis, leaving 11,986 facilities with detailed information on animal type and animal unit count. Before dating analysis began, the data were subset to extract all active operations housing a dominant livestock group, including poultry (chickens and turkeys), swine, beef cattle and dairy cattle. For facilities housing multiple livestock types, EWG identified the dominant livestock type at each facility.

Large Operations

EWG tracked new and expanded large concentrated animal feeding operations, or large CAFOs, defined as any facility that confines at least 1,000 animal units.2 Iowa DNR requires a construction permit for any facility that will confine livestock equivalent to 1,000 or more animal units.

The final count for large, active animal feeding operations to be dated included 3,955 operations.

Historical Imagery

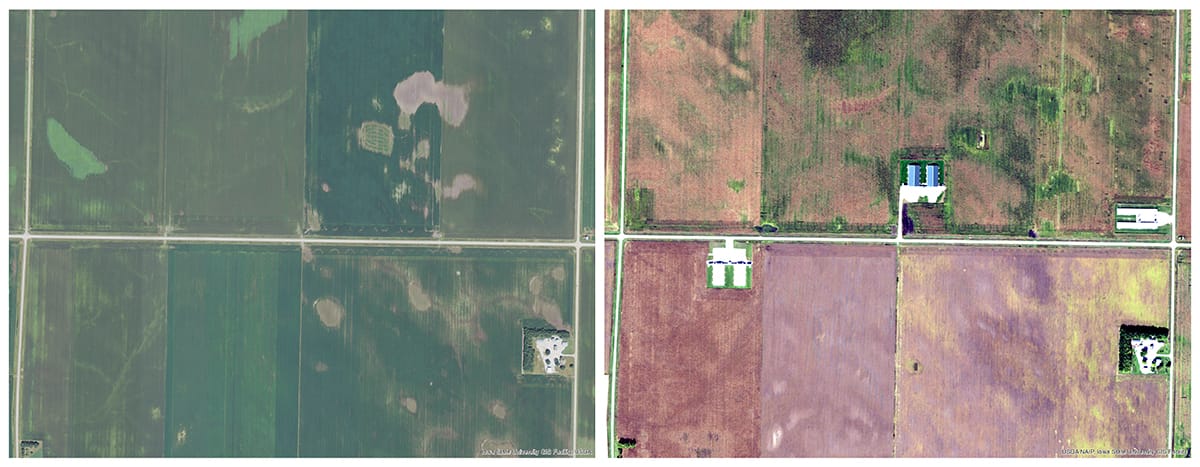
The DNR maintains a large collection of statewide aerial photography, dating as far back as the 1930s. EWG used this collection of aerial photography, along with recent satellite imagery from Planet, to document the history of CAFO construction in Iowa between the 1980s and 2019. Each CAFO housing 1,000 or more animal units was analyzed at seven time stamps, listed below, along with the source of imagery used:

  • 1980s – color infrared aerial photography: 1-meter horizontal resolution.
  • 1990s – aerial orthophotography: 1-meter horizontal resolution.
  • 2002 – color infrared aerial photography: 1-meter horizontal resolution.
  • 2007 – National Agriculture Imagery Program, or NAIP, aerial photography: 2-meter horizontal resolution.
  • 2011 – NAIP aerial photography: 1-meter horizontal resolution.
  • 2017 – NAIP aerial photography: 1-meter horizontal resolution.
  • 2019 – Planet (PlanetScope) satellite imagery: 3-meter horizontal resolution.

Facility Attribution

Several attributes were recorded for each facility, including the year the facility was first observed in imagery and years of expansion, if any. A facility expansion included the addition of or increase in size of livestock barns, or in the case of cattle, the addition of or increase in size of feedlots or paddocks. Expansion also included an increase in facility infrastructure, such as the addition of a lagoon or manure holding tank. Facility attribution was performed using the best judgment of the geographic information system analyst. An additional round of quality control was performed by a separate reviewer.

Nineteen facilities could not be located on any imagery from any of the time stamps, and were therefore removed from the dataset. In total, EWG successfully dated 3,936 large AFOs in Iowa – 99.5 percent of the total number of operations. Reasons for being unable to date a location could include that the facility had not yet been built or was mislocated, or some other recording factor.

Although these facilities account for only a third of Iowa’s AFOs, they contain 62 percent of the animal units from all regulated operations.

Waste Calculation

To estimate animal waste output for a year, the DNR data were used to identify the large operations housing 1,000 or more animal units and the corresponding animal type. These units were then converted to animal counts and given a daily waste estimate, which was then multiplied by 365 to model a year. General assumptions were made for each animal type to streamline the calculation. 

Waste Estimation Assumptions*

Iowa DNR Primary Animal Type

Animal Unit Converstion

General Animal Type

Animal Size (in Pounds)

Daily Waste Output (in Pounds)

Beef

1

Finishing cow

750

37

Dairy

0.7

Lactating cow

1,000

111

Poultry**

82

Layer

3

0.15

Swine

2.5

Finishing pig

150

7.4

* Animal type, size and total manure by pounds, from the 2004 Midwest Planning Service


* Chicken and turkey animal units combined


2019 Waste Estimate

Animal Type

Animal Count

Waste Per Day (in Pounds)

Waste Per Year (in Pounds)

Beef

1 million

38.3 million

14 billion

Dairy

0.2 million

22.1 million

8.1 billion

Poultry

73.4 million

11 million

4 billion

Swine

15.7 million

116.2 million

42.4 billion

Total

90.3 million

187.6 million

68.5 billion


References

  1. 1 States Department of Agriculture Natural Resources Conservation Service. Animal Feeding Operations. https://www.nrcs.usda.gov/wps/portal/nrcs/main/national/plantsanimals/livestock/afo/
  2. 2 1,000 animal units is equivalent to 2,500 hogs, 1,000 cattle, 700 dairy cows or 82,000 laying hens. For more information on animal units in Iowa click here: https://www.lawserver.com/law/state/iowa/ia-code/iowa_code_459-102

Share this page

Share Share

Share Share Share on Social Media

Search by Zip Code

Please type below a 5-digit Zip Code, then click on "SEARCH"