
Overview
- Precipitation increased in almost all Midwestern counties between 2001 and 2020.
- Almost all of those counties also had growing crop insurance costs related to excess moisture over the same period.
- Thanks to the climate crisis, crop insurance costs are likely to continue to rise in the Midwest without program changes that encourage farmers to adapt.
A new EWG analysis has found that the overwhelming majority of Midwestern counties with increased precipitation between 2001 and 2020 also had growing crop insurance costs during that period due to wetter weather linked to the climate crisis.
In all, 661 counties got a crop insurance indemnity payment for excess moisture at some point during that period, adding up to $12.9 billion – one-third of the $38.9 billion in total crop insurance payments for all causes of loss in these counties.
This is the first analysis of the link between recent wetter Midwestern weather caused by climate change and rapidly ballooning crop insurance payments in the region for crops that have failed or been harmed by rain, snow, sleet and other wet weather – issues lumped together by the federal Crop Insurance Program under the term “excess moisture.”
The rapidly intensifying climate catastrophe has already increased the cost of the Crop Insurance Program in parts of the Midwest, and costs are likely to continue to go up without interventions that encourage farmers to adapt to climate change.
As currently set up, the Crop Insurance Program undermines the adoption of conservation practices like cover crops that can help farmers adapt to the effects of the worsening climate disaster, such as extreme precipitation events that are expected to continue occurring more frequently. It discourages such modifications by shielding farmers from the true cost of policies and minimizing the risk to the farmer of planting on marginal lands, among many other climate-unfriendly features.
The program has been heavily subsidized by taxpayers for many years, so as costs continue to rise, the American public will be on the hook, making reforms especially urgent.
Increasing precipitation in the Midwest
The Midwest has had significantly more precipitation in recent years. Annual precipitation amounts grew by between 5 and 15 percent between 1986 and 2015 compared to between 1901 and 1960, according to the Fourth National Climate Assessment. Depending on the year and location, this is due to more rain throughout the year, more frequent heavy precipitation events, or both. (These trends have continued since 2015, but that is the last year studied by the Fourth National Climate Assessment.)
EWG analyzed National Oceanic and Atmospheric Administration data to evaluate which counties in the Midwest have seen increased annual precipitation. We found that, of the 738 counties in the Midwestern states of Illinois, Indiana, Iowa, Michigan, Minnesota, Missouri, Ohio and Wisconsin, 683 had rising annual county-level precipitation between 2001 and 2020. (See Methodology for more information.)
The region is also expected to see more precipitation under the different projected greenhouse gas emission scenarios. Hotter warm season temperatures and periods of extreme rain followed by drought are likely across the region, which is predicted to have serious effects on agriculture.
Wetter weather leads to more excess moisture payments
Between 2001 and 2020, farmers in the eight Midwest states received almost $14.5 billion in crop insurance indemnity payments for reduced crop yields or revenue due to excess moisture and precipitation.
Indemnity payments are often made because of weather-related reductions in crop yield, so the Crop Insurance Program is inherently tied to the climate crisis. Nationally, excess moisture, precipitation or rain has been the second largest cause of crop insurance payments since 1995, smaller only than payments triggered by drought.
Some indemnities come from the money farmers pay, but additional payments – when losses exceed premiums – are largely funded by taxpayers. Premium subsidies are paid for solely by taxpayers.
Out of the 738 counties in the Midwestern states in our analysis, precipitation increased in 92.5 percent – 683 counties – between 2001 and 2020. And of those, almost 97 percent – 661 counties – got a crop insurance indemnity payment for excess moisture at some point during that period, with a total of $12.9 billion. This is 33 percent of the $38.9 billion in total crop insurance payments for all causes of loss in these counties.
The map below shows the 661 Midwestern counties and their excess moisture crop insurance payments.
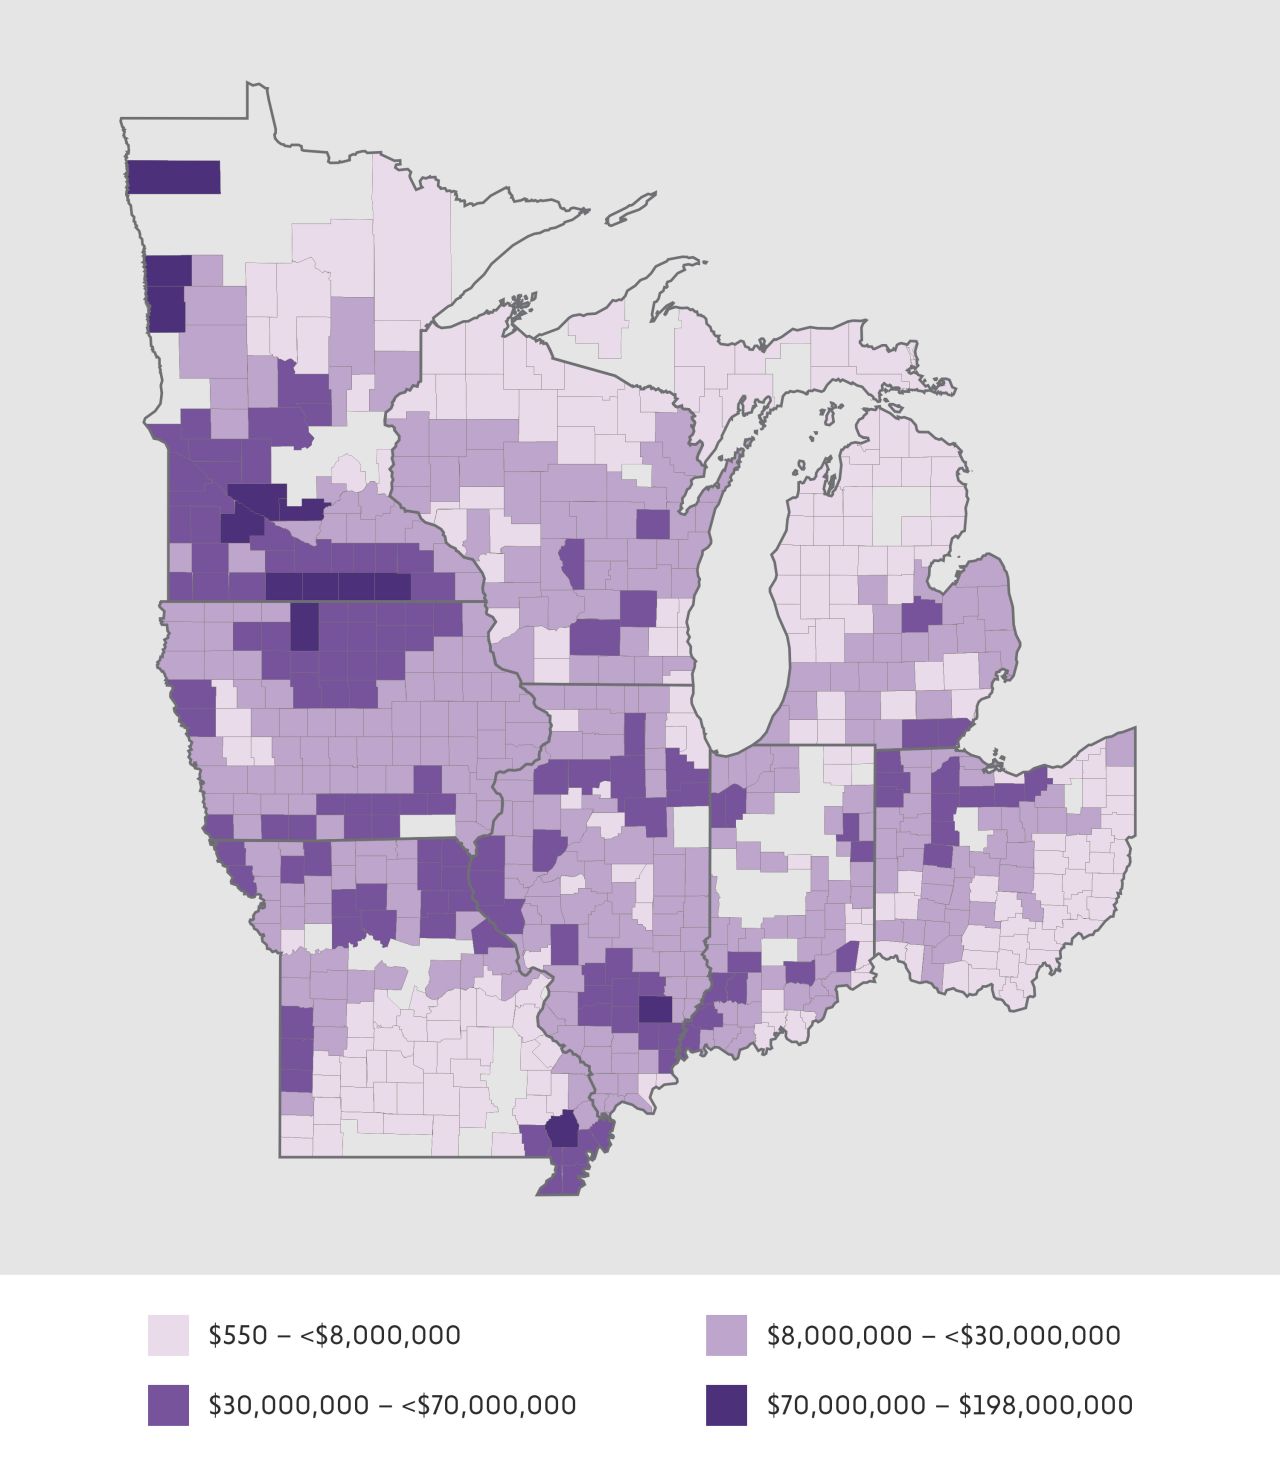
Source: EWG, from NOAA, Climate at a Glance and USDA Risk Management Agency, Cause of Loss Historical Data Files.
Excess moisture costs rose over time
Over the period we studied, excess moisture crop insurance costs – not just indemnities, but also premium subsidies, policies and acres – went up in nearly all the 661 counties that both had increasing annual precipitation and received an excess moisture payment.
The numbers are stark:
- 98 percent of counties had increasing excess moisture indemnities.
- 99 percent had increasing excess moisture premium subsidies.
- 95 percent had increasing excess moisture indemnified acres.
- 90 percent had increasing excess moisture indemnified policies.
Figure 1. Excess moisture indemnities for the 661 counties that received payments went up between 2001 and 2020.
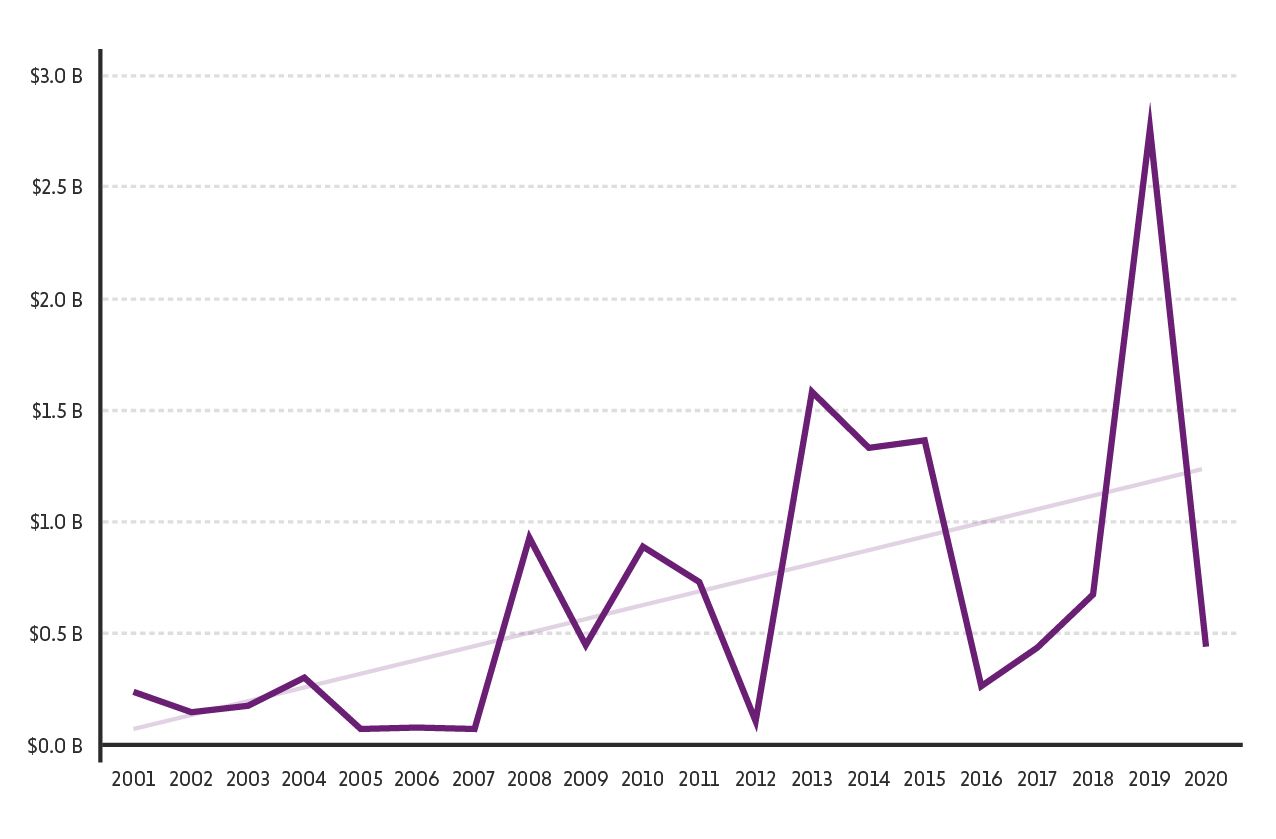
Source: EWG, from NOAA, Climate at a Glance and USDA Risk Management Agency, Cause of Loss Historical Data Files.
During the period we studied, total crop insurance costs and program participation increased. But these two trends – alone or in combination – don’t explain why excess moisture costs have also gone up, because excess moisture as a share of the program’s total cost also grew.
In these 661 counties, excess moisture is becoming a bigger expense, compared to all causes of crop insurance losses:
- In 93 percent of counties, excess moisture indemnities went up as a proportion of total indemnities.
- In 88 percent, excess moisture subsidies grew as a share of all subsidies.
- In 94 percent, acres with excess moisture indemnities rose as a proportion of all indemnified acres.
- In 88 percent, policies with excess moisture indemnities increased as a share of all indemnified policies.
Climate-friendly farming can help reduce crop insurance costs
As long as precipitation in the Midwest grows due to the climate crisis, excess moisture-related crop insurance expenses will probably also continue to increase.
Farmers can implement one or more of many conservation practices that can help them adapt to extreme weather conditions linked to the climate crisis, as well as reduce their greenhouse gas emissions. Some practices, like cover crops, reduced or no tillage, contour buffer strips and grassed waterways, are particularly good for farms that get too much precipitation.
EWG found that some of the Midwestern counties with increasing annual precipitation but decreasing excess moisture crop insurance payments received a high level of financial support for cover crops from a Department of Agriculture conservation initiative called the Environmental Quality Incentives Program, or EQIP.
Only 49 counties had increasing precipitation but decreasing excess moisture payments as a percentage of all crop insurance payments between 2001 and 2020. Of these, five ranked in the top 100 counties for most EQIP spending on cover crops between 2017 and 2020, according to EWG’s Conservation Database (Table 1).
Two counties ranked in the top 10 for most EQIP cover crop spending. Mahnomen and Marshall counties in Minnesota had increasing precipitation over time but decreasing excess moisture payments as a percent of all crop insurance payments. They ranked fourth and 10th, respectively, of all 660 counties for most cover crop EQIP funding between 2017 and 2020, with total cover crop payments of over $3.3 million.
Table 1. Five counties with increasing precipitation but decreasing excess moisture indemnities as a percent of all indemnities ranked in the top 100 counties for most EQIP cover crop spending, 2017-2020.
| County | State | EQIP cover crop spending | Cover crop rank |
|---|---|---|---|
| Mahnomen | Minn. | $1,835,917 | 4 |
| Marshall | Minn. | $1,473,589 | 10 |
| Brown | Wis. | $940,141 | 27 |
| Preble | Ohio | $485,970 | 70 |
| Isabella | Mich. | $417,767 | 85 |
| Total | $5,153,384 |
Source: EWG, from NOAA, Climate at a Glance, USDA Risk Management Agency, Cause of Loss Historical Data Files and public records requests for USDA-NRCS EQIP data.
The Crop Insurance Program needs to be reformed to help farmers in the Midwest, and throughout the country, adapt to the climate crisis. Many changes can be made to the program to help accomplish this. Conservation practices like cover crops can help farmers adapt to extreme weather conditions made worse by climate change, like severe rainstorms, and potentially reduce the costs of crop insurance.